Many new options traders focus only on stock price direction, overlooking the single biggest driver of option prices — volatility. This article explains IV, HV, and IVP in plain English, then walks through real signals from AI Stock Monitor to show why options sellers should only enter when IV is elevated.
Three Core Concepts You Must Know
Mastering these three terms unlocks the core logic behind every premium-selling strategy:
Today's IV-High Signals from AI Stock Monitor
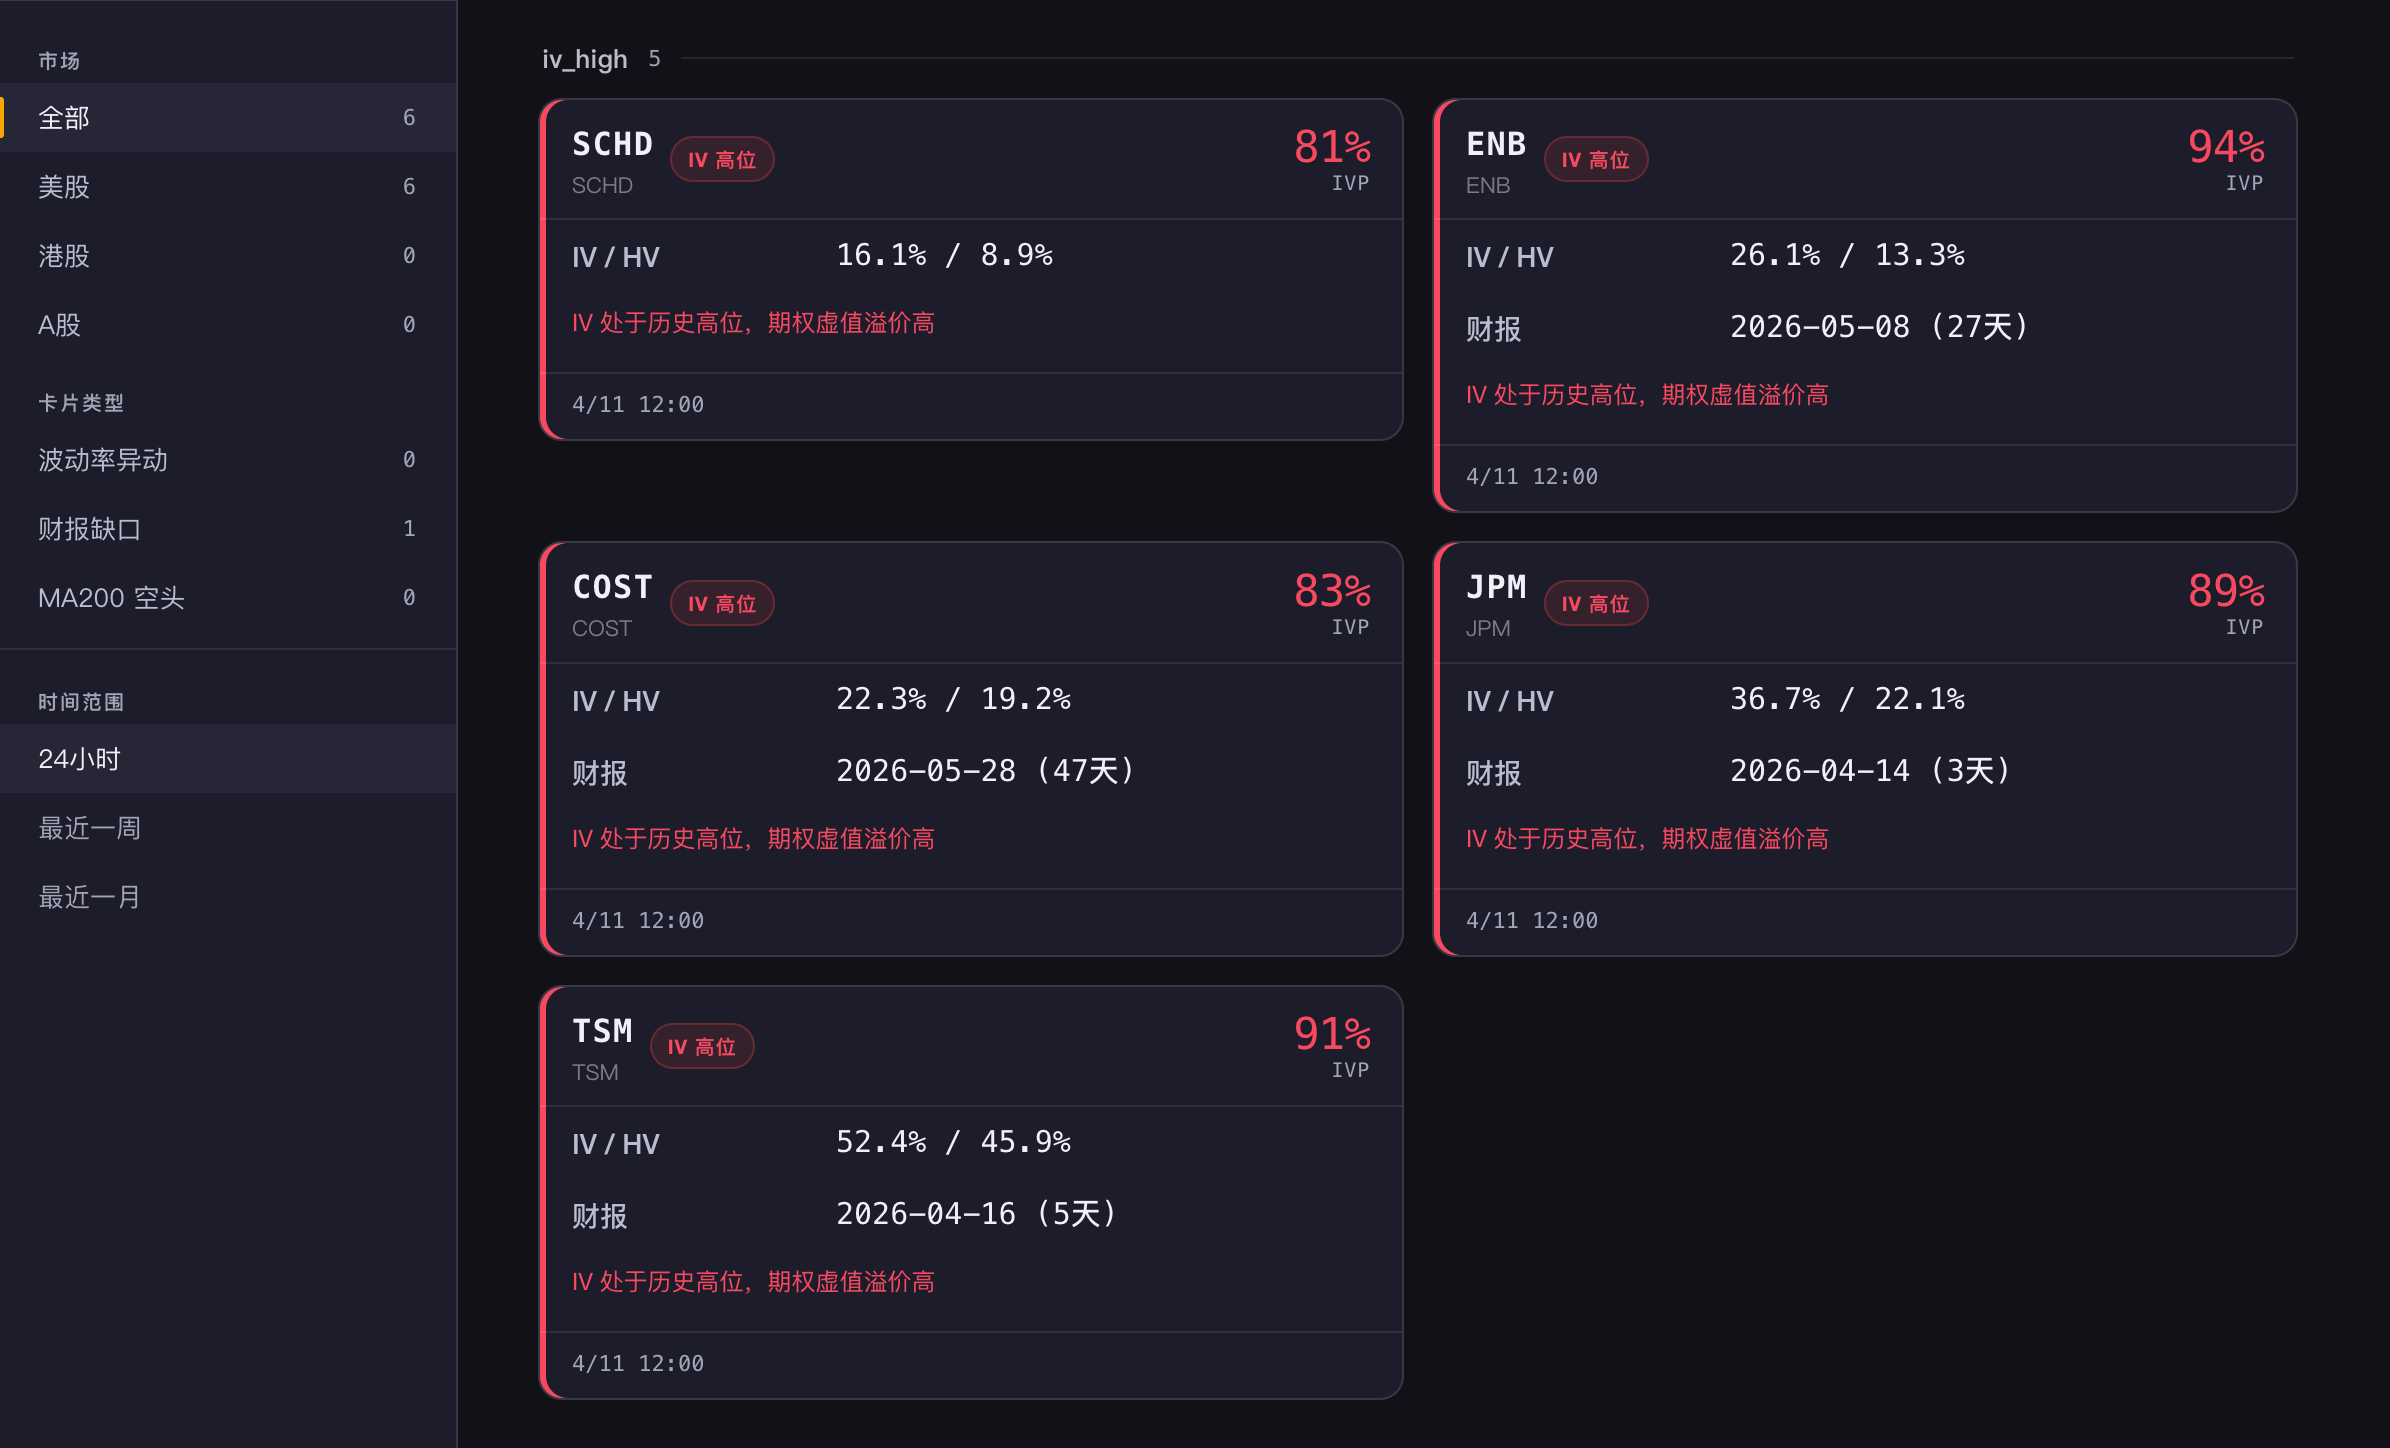
Below are some of the IV-high alerts detected by AI Stock Monitor on April 11, 2026 — a subset of the full signal list for the day:
Why High IV Is the Golden Window for Selling Options
Option Prices Are Driven by Volatility Expectations, Not Stock Price
A common misconception is that expensive stocks have expensive options and cheap stocks have cheap options. In reality, option prices are primarily driven by volatility — the more the market expects the underlying to swing, the pricier the options. When expectations are calm, options are cheap.
Look at SCHD: its HV is only 8.9%, meaning this ETF barely moves in normal conditions. Yet its current IV is 16.1% — nearly twice the realized volatility. That spread is the fear premium that the market has pushed into option prices.
Why Use IVP Instead of Raw IV?
Different stocks have very different baseline IV levels. A low-volatility blue chip might sit at 15% IV year-round, while a tech name might hover around 40%+. A raw IV number alone cannot tell you whether options are "expensive" — you need to compare it against the stock's own history. That is exactly what IVP does.
An IVP above 80% means current IV is at a historically extreme level — premium is rich relative to what this stock normally offers. That is the signal sellers look for.
The Four-Step IV Monitoring Logic
How AI Stock Monitor Helps You Track IV
Manually checking IV and IVP across every position is slow and easy to miss. AI Stock Monitor continuously scans your portfolio and watchlist for volatility data, and pushes alerts the moment IVP crosses your threshold — so you never miss a golden window.
The SCHD, ENB, and COST signals in this article were automatically flagged on April 11 — part of a full day of continuous monitoring and real-time updates.
High volatility = rich premium
Sell when options are most expensive — collect the fattest premium
That is what AI Stock Monitor helps you do