Earnings season is the most exciting — and most dangerous — window for options traders. Stock prices routinely gap 5%, 10%, or more overnight after a report drops. This article explains what earnings gaps are, how to read historical gap data, and how to use AI Stock Monitor's gap signals to make better options decisions.
What Is an Earnings Gap?
An earnings gap is the overnight price jump that occurs after a company reports quarterly results. For example, if a stock closes at $100 and opens at $95 the next morning after a disappointing report, that 5% drop is the earnings gap.
Here are the three key data points you need to understand:
Live Earnings Gap Signals from AI Stock Monitor
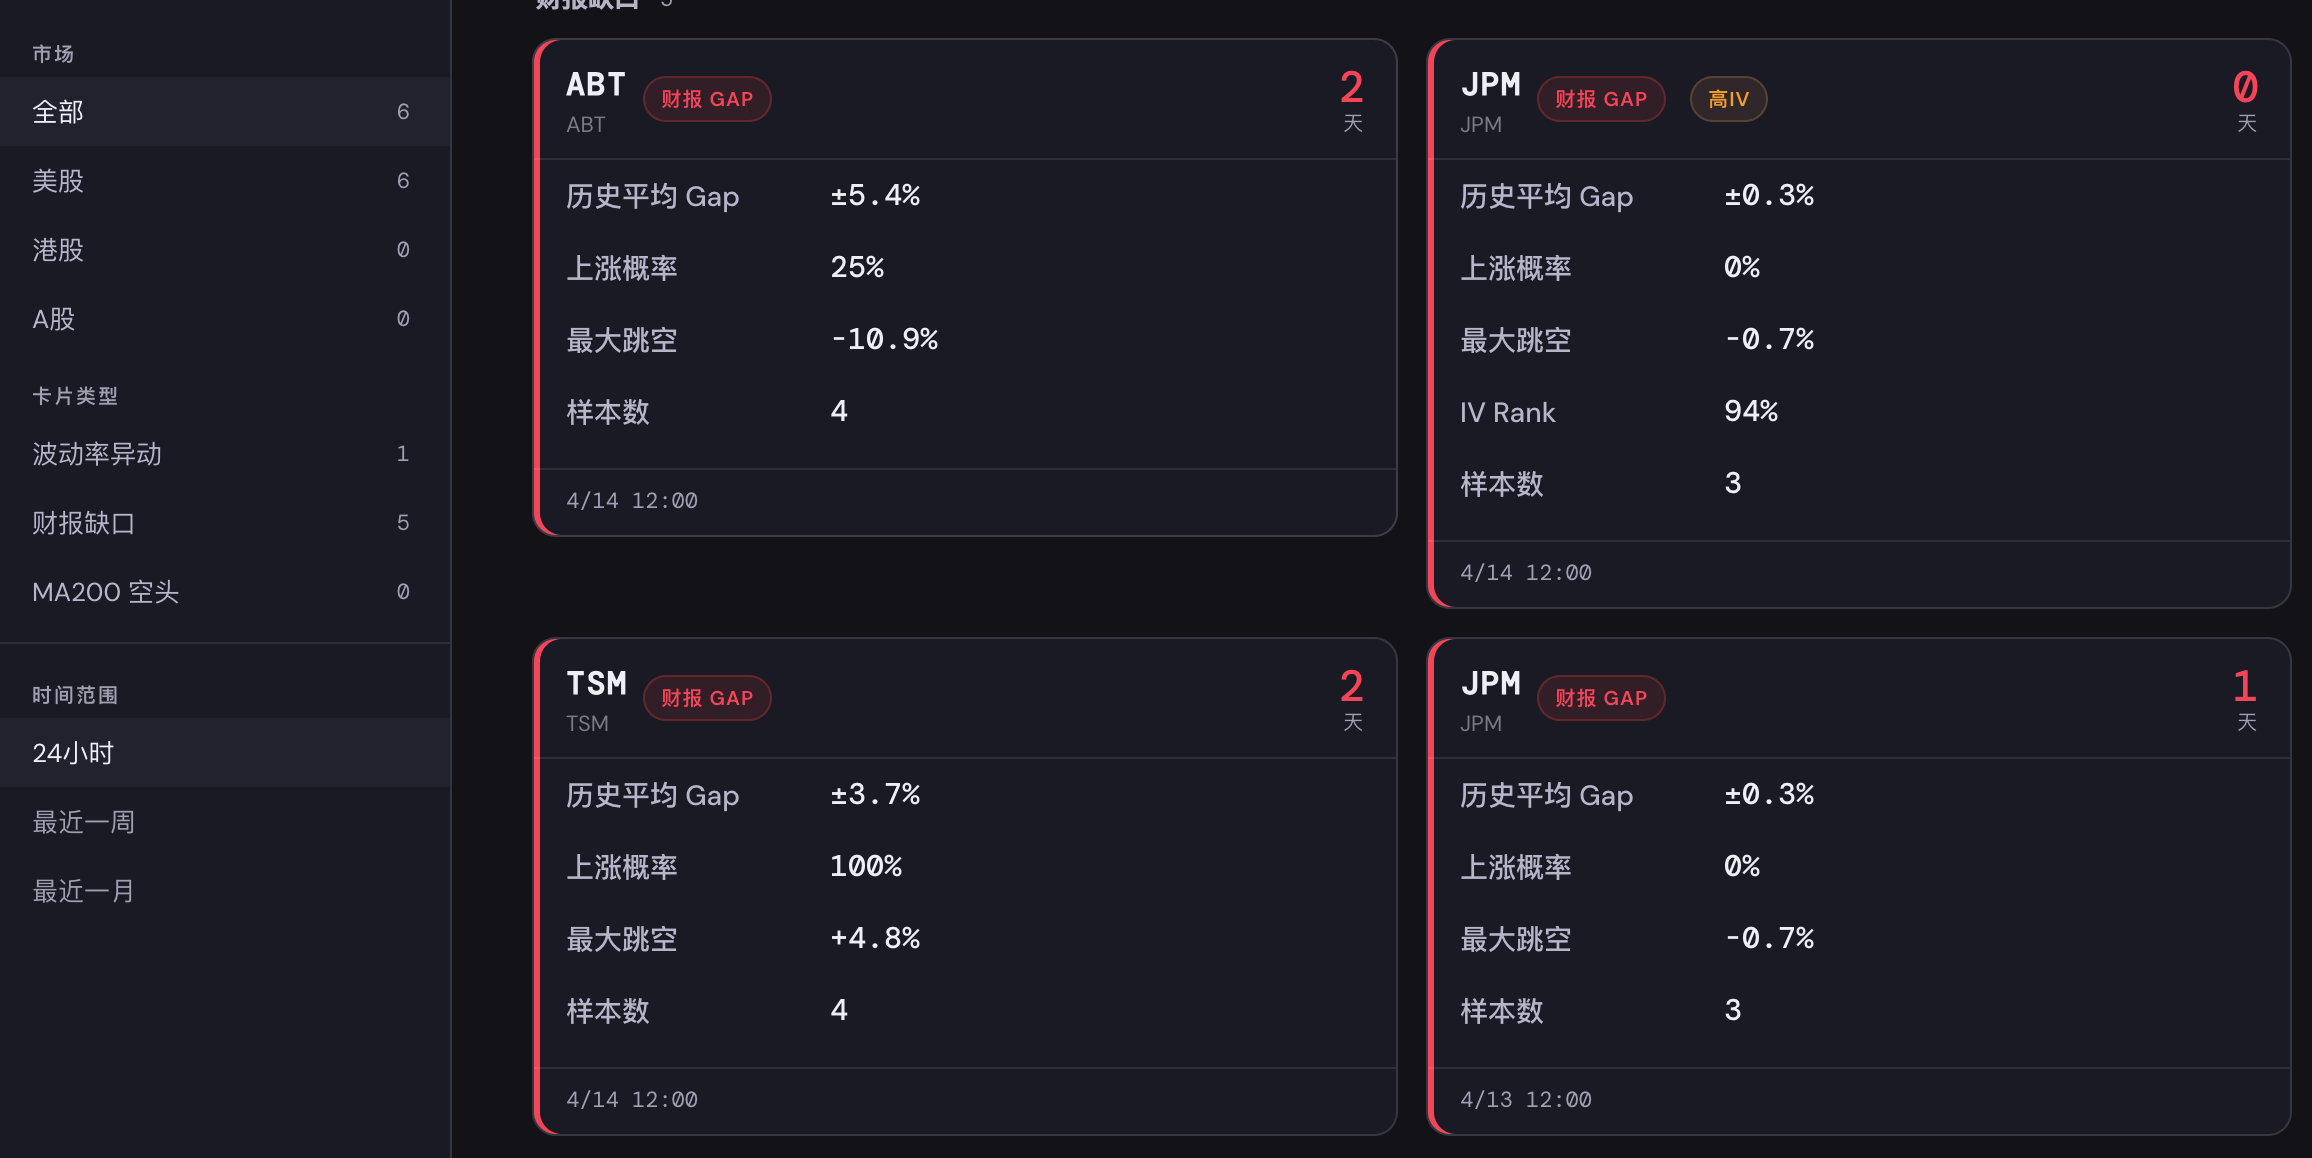
Below are earnings gap alerts detected by AI Stock Monitor on April 14, 2026:
How to Use Earnings Gap Data for Options Decisions
Seller's Perspective: Gap Data Sets Your Strike Distance
If you plan to sell options into earnings — say, a short put or an iron condor — the historical average gap and max gap are the core references for setting your strike price. Your strike distance from the current price should be at least as wide as the historical average gap, and ideally wide enough to survive the max gap.
Take ABT as an example: the average gap is ±5.4%, and the max gap is -10.9%. If you sell a put, your strike should be at least 5.4% below the current price — and conservative sellers would want 10%+ of downside cushion.
Buyer's Perspective: Big Gap + Directional Skew = Opportunity
If a stock historically gaps large on earnings (like TSM's ±3.7%) and the up probability is highly skewed to one side (TSM has gapped up 100% of the time), buyers can consider directional plays before the report. But be aware — IV is usually elevated pre-earnings, so the gap expectation is already priced in.
This is exactly why JPM triggered a dual signal: earnings gap + IV high. With an IV Rank of 94%, options are expensive — buyer's cost is high, which actually favors sellers.
The Four-Step Earnings Options Framework
How AI Stock Monitor Tracks Earnings Gaps
Manually checking every holding's earnings date, historical gap stats, and IV levels is tedious and error-prone. AI Stock Monitor scans your portfolio and watchlist automatically, pushing gap alerts as earnings approach — including the average gap, up probability, max gap, IV level, and countdown.
The ABT, TSM, and JPM signals in this article were automatically detected on April 14. When a gap signal and an IV-high signal fire together (like JPM), the system stacks the labels so you know this is a window that demands extra attention.
Earnings gap = your risk boundary
Know how far it has jumped before — then decide how far to place your strike
AI Stock Monitor helps you size every earnings trade